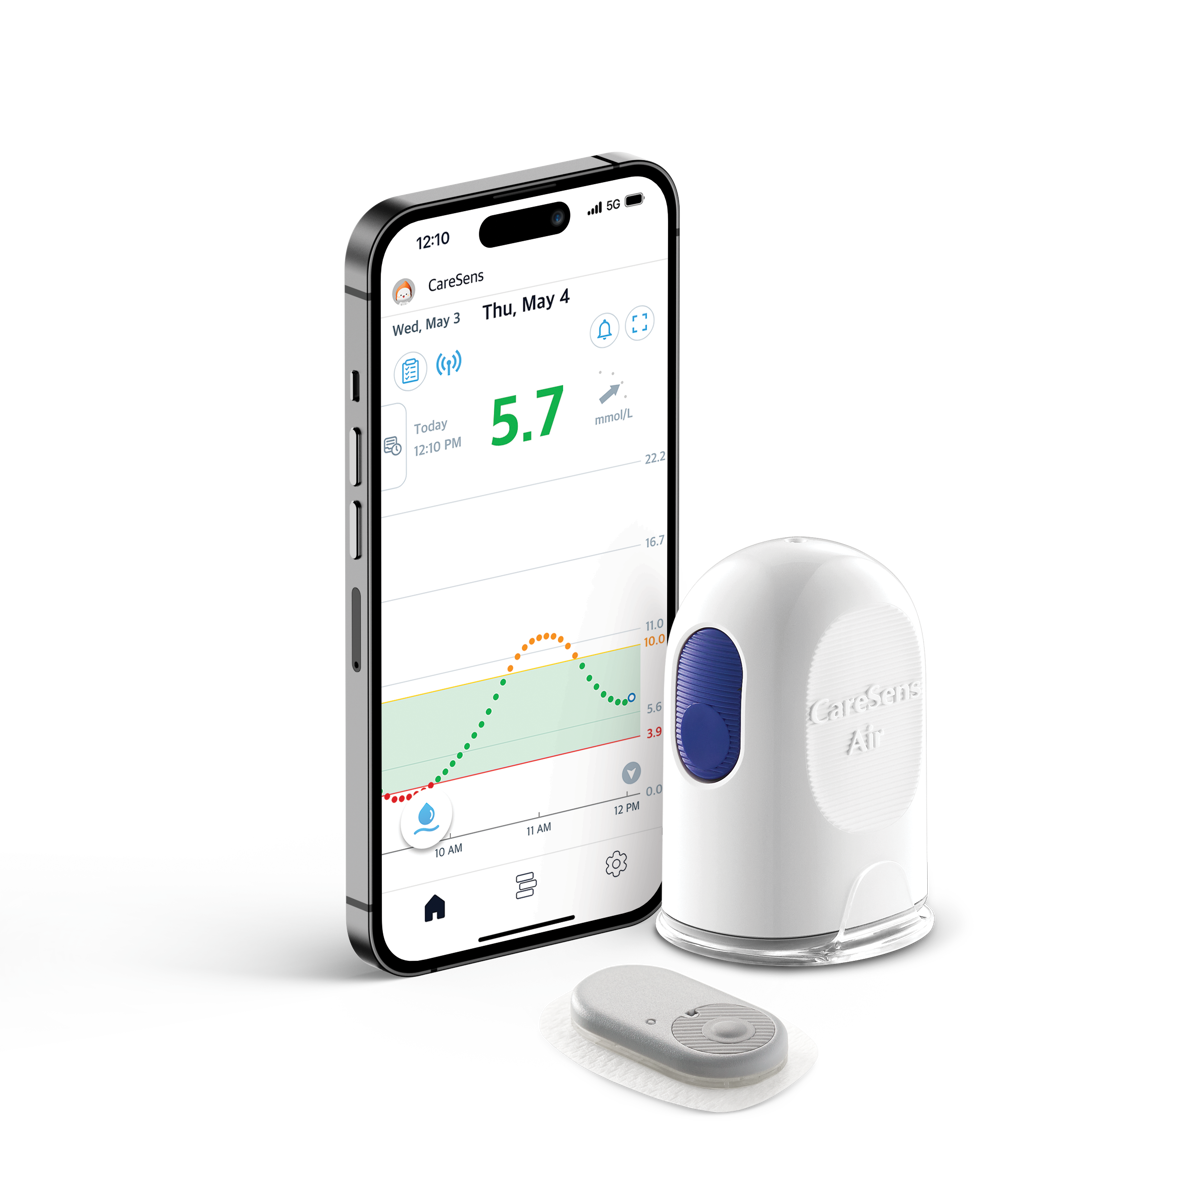
Manage your diabetes, anytime, anywhere with the CareSens Air app.
Essential for the CareSens Air CGM device, the app syncs seamlessly with your CareSens Air device to receive data directly on your phone. This gives you instant insights, trends and alerts to help simplify the management of your diabetes.
Check glucose trends in real time.
Track how your glucose levels change over time with easy-to-read trend graphs. See the speed and direction of change in your glucose levels using the easy to understand trend arrows.
By understanding your glucose patterns, you can take action sooner - helping you stay within your target range and manage highs and lows.

Stable Glucose Level

Slow Increase / Decrease

Increasing or Decreasing

Rapid Increase / Decrease
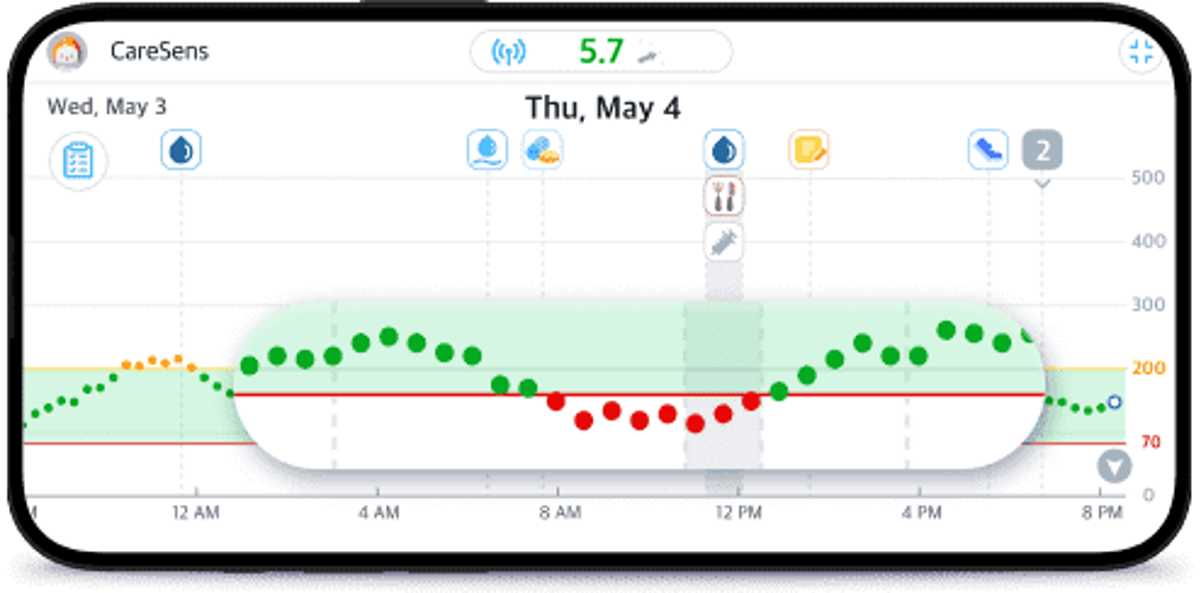
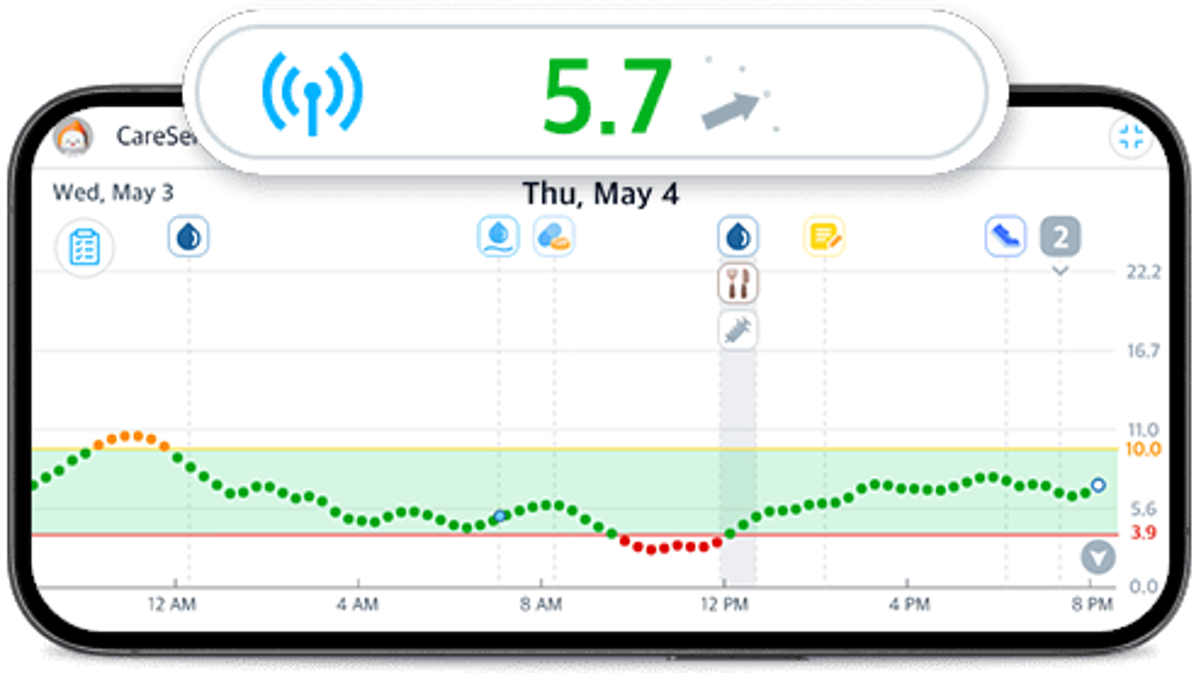
Glucose Graph
- It's easy to track the trend of your glucose over time with a quick glance at the graph.
- Simply tap on any dot on the graph to view the corresponding glucose value at that specific time.
- Additionally, the vertical screen displays 24-hour statistics, while the horizontal screen shows statistics for the entire tracking period.
If current sensor readings do not match symptoms or expectations, test with a glucose meter.
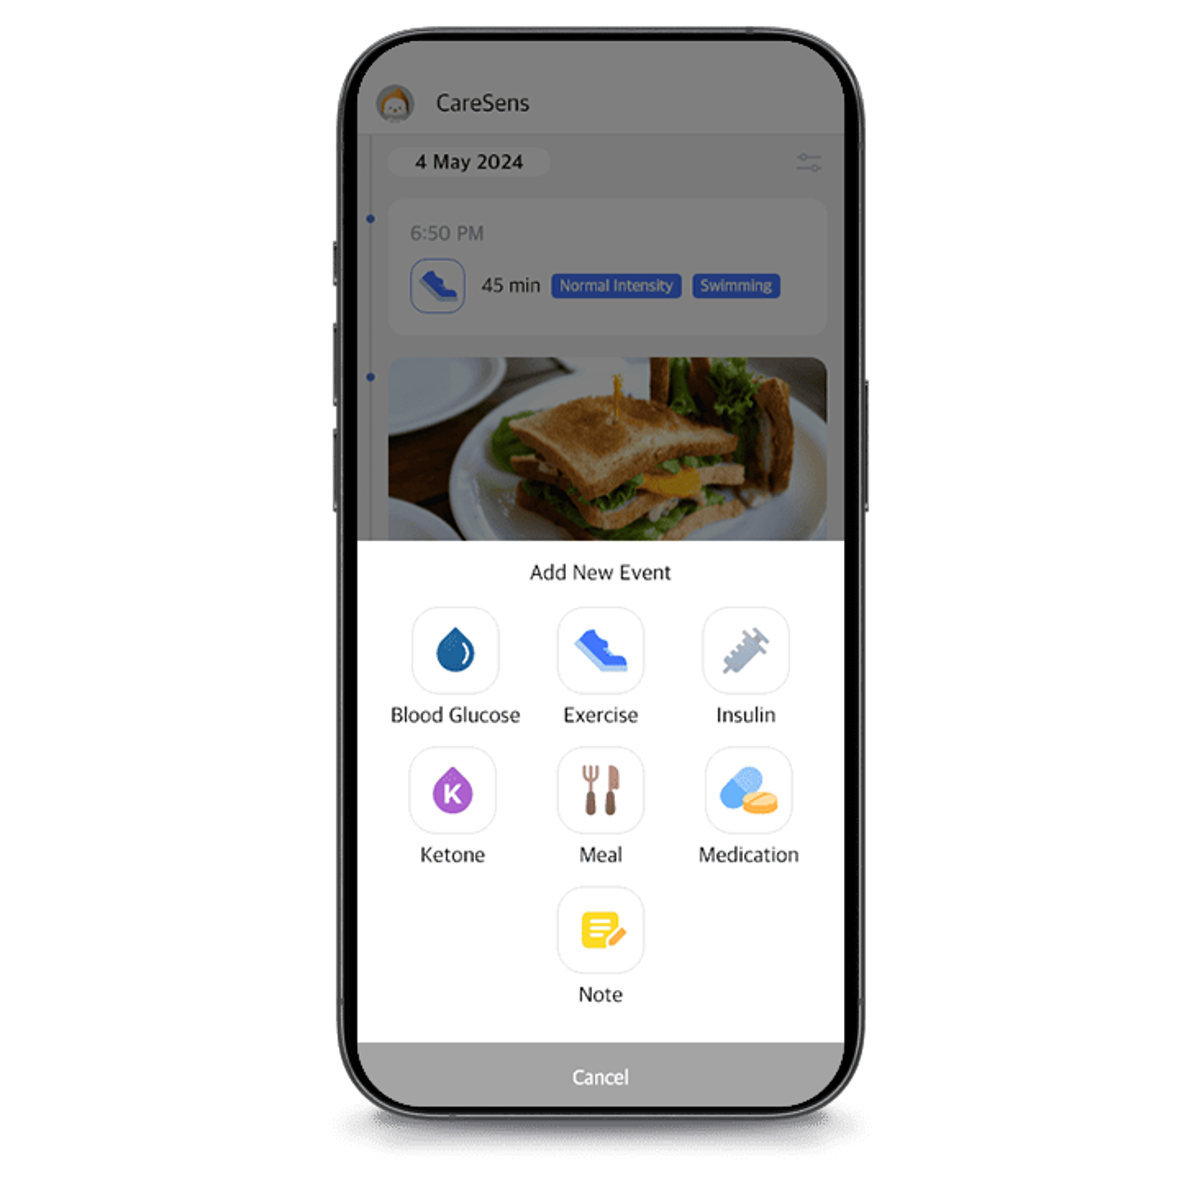
Start managing your glucose effectively with lifelog event logs.
Enter lifelog events for activities and situations that can affect your glucose values.
Understanding the difference between your glucose values before and after an event on your glucose graph can help you control your glucose.
Keep a steady record to find your own patterns of glucose changes.
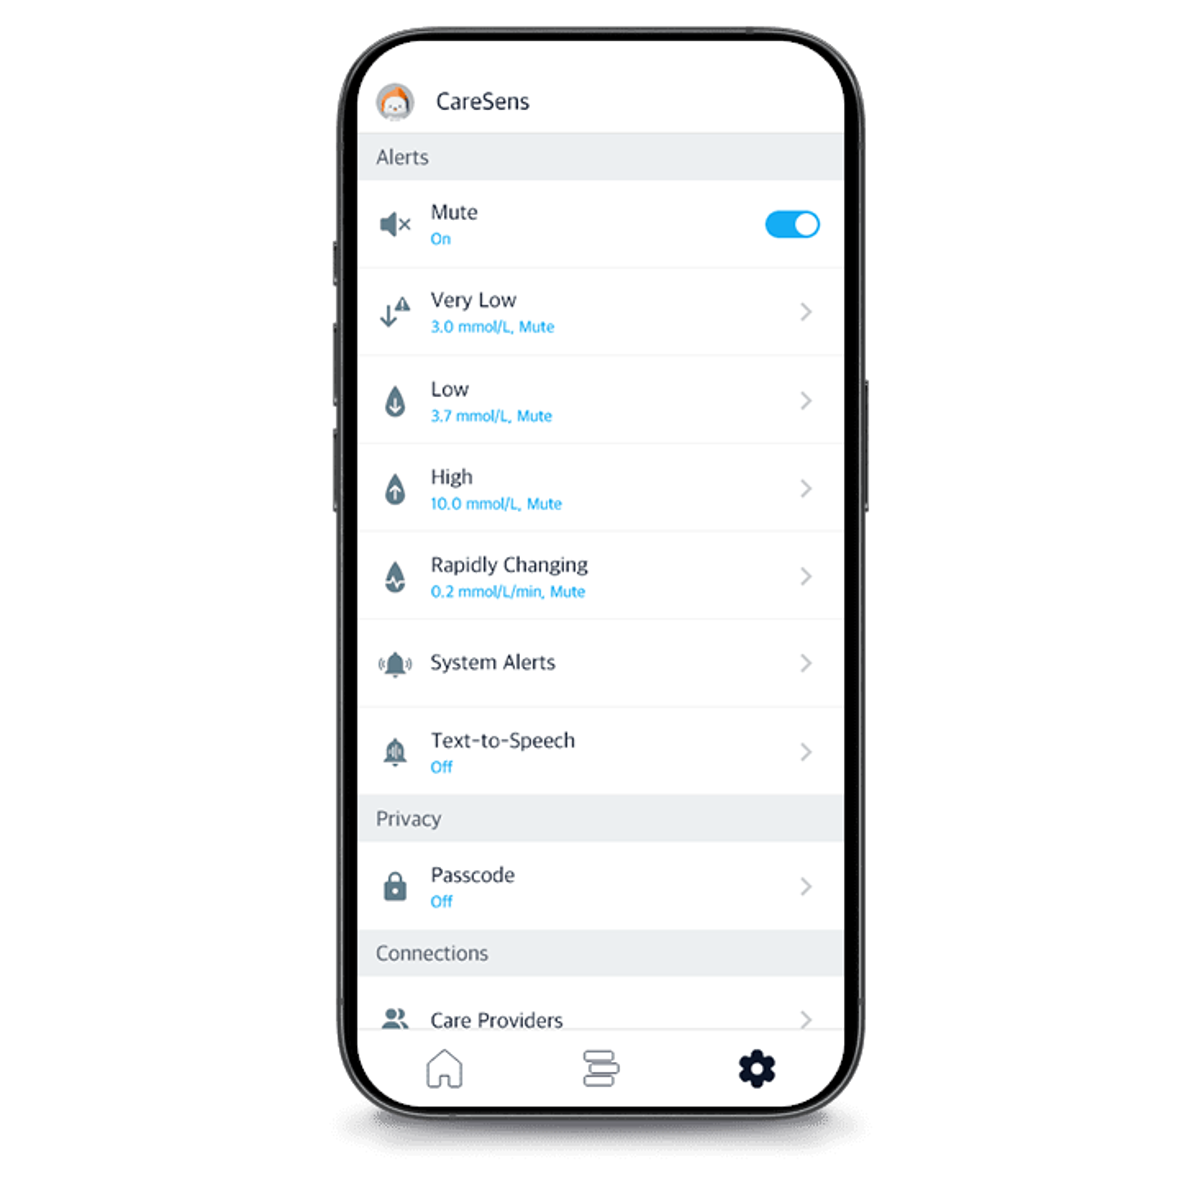
Don't miss out on important glucose events by setting up glucose alerts.
Customise your alert preferences based on your glucose management goals. Set specific thresholds for very low, low, high and rapidly changing levels for each glucose event.
The CareSens Air continuous glucose monitoring system (CGMS) is indicated for the management of diabetes mellitus via the measurement of glucose in the interstitial fluid in people aged 18 years and over. CareSens Air is a class IIb medical device. If current sensor readings do not match symptoms or expectations, use a glucose meter to make diabetes treatment decisions. Talk to your healthcare professional to see if this product is right for you.